SMOT and Model Selection
In Part 1, I went over EDA and a feature selection process. Please visit Part 1 for the review. This part covers synthetic minority oversampling techniques (SMOT) and model selection. Synthetic minority oversampling techniques is a very useful strategy to combat imbalanced classes. Most people usually don’t find matches at speed dating events, thus the data comes with imbalanced classes. From my experience, SMOT is also extremely valuable in increasing model’s accuracy. Almost every time I would use SMOTs, I drastically increased my accuracy scores.
However, going through the interview process for data science positions, I realized that many industry experts use a simple logistic regression to combat imbalanced classes. Here, I want to demonstrate that combating imbalanced classes with more sophisticated techniques can substantially outperform logistic regression. Applying these techniques can save company several thousands or even millions dollars in revenue. In industry, instead of predicting a speed dating match we need to match an advertiser with a publisher or do risk assessment and evaluation for loans. Thus, improving accuracy of an algorithm can substantially increase profitability of a company.
In this project, I implemented several SMOT techniques and chose the one that would give me the best accuracy across seven classifiers: 1) Decision Tree, 2) Logistic Regression, 3) Bagging DT, 4) Random Forest, 5) Extra Trees, 6) Ada Boost, and 7) Gradient Boosting.
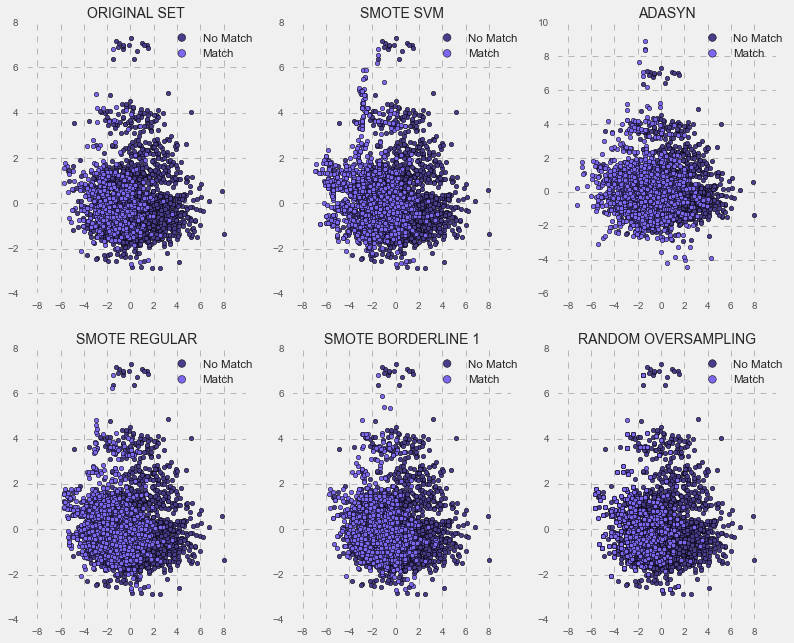
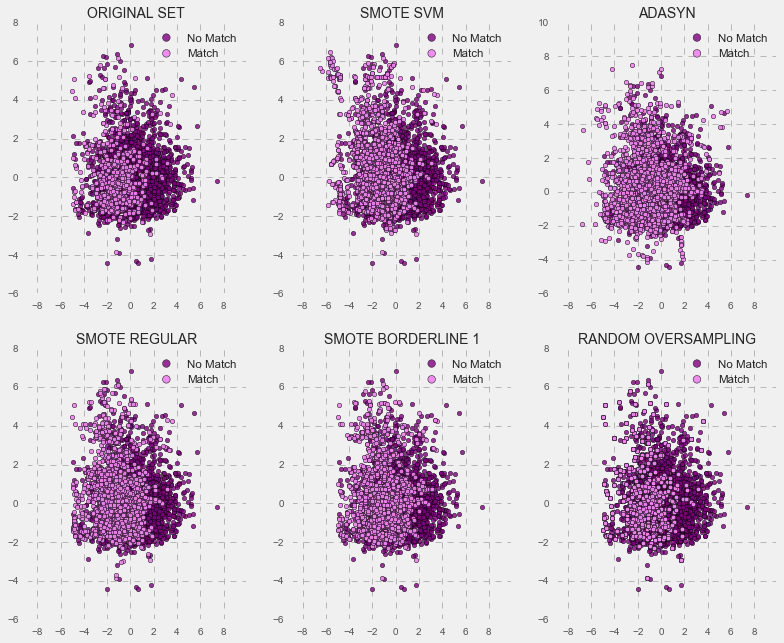
Below is an illustration of various synthetic minority oversampling techniques for the male model (in blue) and female model (in purple). As you can see from the graphs, they create additional data for the imbalanced class “match”, but they use different approaches.
MALE MODEL
FEMALE MODEL
I will not go into a detailed description of each technique, but, generally, SMOTs oversample by creating “synthetic” examples rather than by over-sampling with replacement. On the other hand, Random Oversampling works by randomly over-sampling with replacement. Previous research (Chawla, et al., 2002; Ling & Li, 1998; Japkowicz, 2000) noted Random Oversampling doesn’t significantly improve minority class recognition. As you see below, Random Oversampling improved minority class recognition on the balanced training set, but when I tested it on the imbalanced data set, it delivered only slightly better scores compared to logistic regression. The best test accuracy scores for the imbalanced data set were obtained using the regular synthetic minority over-sampling technique (SMOT Regular). Basically, my strategy was to tune and train my model using the SMOT-balanced training set, and then test its performance in comparison with the same algorithm trained on the imbalanced set and a logistic regression trained on the imbalanced data set with adjusted class weights.
In the tables of accuracy scores below, you can see that the SMOTs techniques drastically boost accuracy scores of the balanced training set.
MALE MODEL
| Classifiers | ORIGINAL | SMOT SVM | ADASYN | SMOT REGULAR | SMOT BORDER1 | RANDOM OVER |
|---|---|---|---|---|---|---|
| Decision Tree | 0.832 ± 0.030 | 0.904 ± 0.013 | 0.901 ± 0.018 | 0.899 ± 0.016 | 0.897 ± 0.016 | 0.891 ± 0.019 |
| Logistic Regression | 0.893 ± 0.022 | 0.895 ± 0.011 | 0.875 ± 0.017 | 0.891 ± 0.018 | 0.891 ± 0.015 | 0.880 ± 0.012 |
| Bagging DT | 0.893 ± 0.018 | 0.928 ± 0.013 | 0.931 ± 0.020 | 0.931 ± 0.016 | 0.936 ± 0.017 | 0.948 ± 0.016 |
| Random Forest | 0.885 ± 0.024 | 0.936 ± 0.010 | 0.936 ± 0.011 | 0.937 ± 0.011 | 0.936 ± 0.014 | 0.952 ± 0.018 |
| Extra Trees | 0.881 ± 0.025 | 0.940 ± 0.011 | 0.943 ± 0.010 | 0.947 ± 0.007 | 0.945 ± 0.015 | 0.968 ± 0.010 |
| Ada Boost | 0.886 ± 0.029 | 0.930 ± 0.012 | 0.921 ± 0.016 | 0.926 ± 0.014 | 0.926 ± 0.018 | 0.895 ± 0.016 |
| Gradient Boosting | 0.896 ± 0.020 | 0.938 ± 0.015 | 0.931 ± 0.015 | 0.939 ± 0.014 | 0.944 ± 0.016 | 0.916 ± 0.012 |
FEMALE MODEL
| Classifiers | ORIGINAL | SMOT SVM | ADASYN | SMOT REGULAR | SMOT BORDER1 | RANDOM OVER |
|---|---|---|---|---|---|---|
| Decision Tree | 0.886 ± 0.029 | 0.935 ± 0.009 | 0.930 ± 0.014 | 0.927 ± 0.017 | 0.930 ± 0.009 | 0.922 ± 0.016 |
| Logistic Regression | 0.917 ± 0.020 | 0.933 ± 0.011 | 0.922 ± 0.009 | 0.933 ± 0.014 | 0.934 ± 0.015 | 0.925 ± 0.011 |
| Bagging DT | 0.921 ± 0.018 | 0.946 ± 0.010 | 0.949 ± 0.013 | 0.946 ± 0.015 | 0.952 ± 0.010 | 0.959 ± 0.009 |
| Random Forest | 0.905 ± 0.011 | 0.950 ± 0.006 | 0.961 ± 0.006 | 0.957 ± 0.010 | 0.955 ± 0.011 | 0.965 ± 0.009 |
| Extra Trees | 0.907 ± 0.011 | 0.959 ± 0.008 | 0.962 ± 0.010 | 0.960 ± 0.008 | 0.960 ± 0.006 | 0.969 ± 0.009 |
| Ada Boost | 0.919 ± 0.013 | 0.945 ± 0.012 | 0.943 ± 0.007 | 0.948 ± 0.010 | 0.949 ± 0.008 | 0.933 ± 0.010 |
| Gradient Boosting | 0.928 ± 0.014 | 0.952 ± 0.009 | 0.948 ± 0.010 | 0.955 ± 0.012 | 0.956 ± 0.009 | 0.943 ± 0.010 |
Extra Tree classifier exibited the best perfomace across the SWOTs techniques. Thus, my choice was the Extra Tree classifier trained on the balanced data set using the regular synthetic minority oversampling technique. I tested it on the imbalanced test data set and compared its accuracy to the accuracy of the Extra Tree classifier that was trained and tested on the imbalanced data set and the logistic regression with adjusted class weights that was trained and tested on the imbalanced data set. The table below represents training and test accuracy scores for the tuned algorithms.
| Classifiers | ACCURACY OF MALE MODEL | ACCURACY OF FEMALE MODEL |
|---|---|---|
| TRANING SET: | ||
| Logistic Regression | 89.38% | 92.00% |
| Extra Tree Classifier | 90.01% | 92.66% |
| Extra Tree Classifier SMOT | 95.19% | 96.42% |
| TEST SET: | ||
| Logistic Regression | 89.70% | 92.47% |
| Extra Tree Classifier | 90.49% | 92.11% |
| Extra Tree Classifier SMOT | 97.93% | 98.00% |
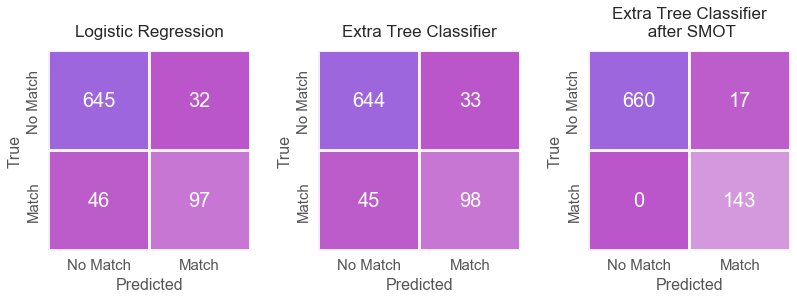
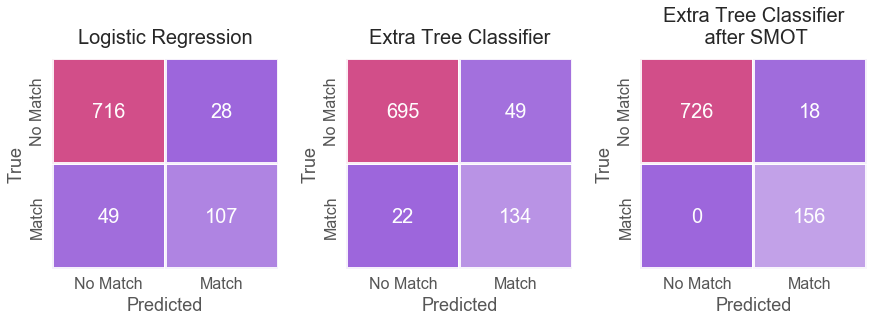
As seen in the table above, the SMOT Extra Tree classifier outperformed the Extra Tree Classifier and logistic regression. In addition, as seen below from the confusion matrices, the SMOT Extra Tree classifier substantially improved precision and recall accuracies for the imbalanced class on the test set (14%-19% and 43%-45%, correspondingly).
MALE MODEL
FEMALE MODEL
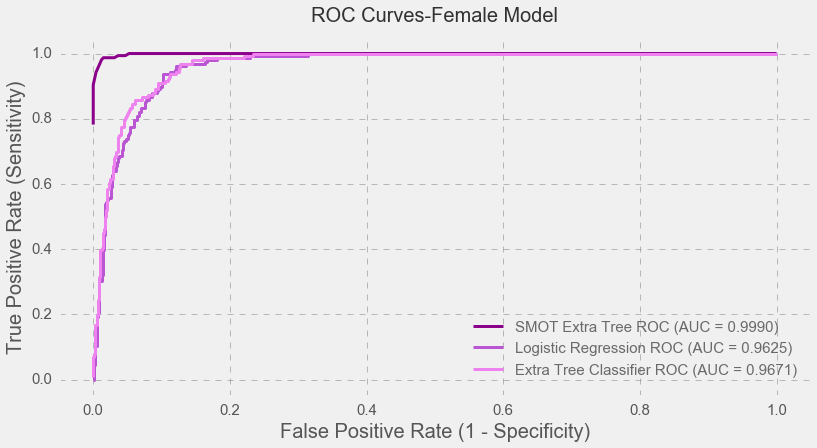
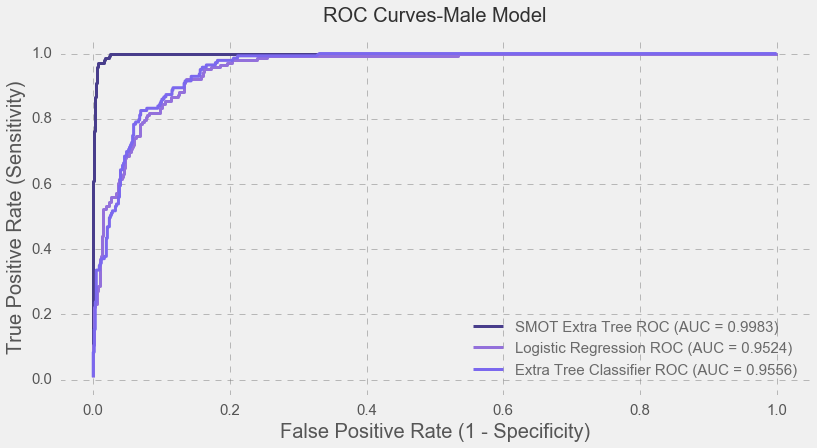
Moreover, as seen below, the SMOT Extra Tree classifier helped to yield nearly perfect AUC scores for the both models.
Conclusion
In this project, I’ve implemented feature selection techniques and modeling techniques to build two machine learning models. I also applied a synthetic minority oversampling technique to improve accuracy scores of the models as well as precision and recall accuracies for the imbalanced class. This project demonstrated that the SMOT Extra Tree significantly outperformed the logistic regression and boosted prediction accuracy scores by at least 6 % while boosting precision and recall accuracies of the imbalanced class by 14-19 % and 43-45 %, correspondingly. This is a drastic improvement. In industry, most of the time, the imbalanced class is the class that we need to predict accurately, and using simple logistic regression with class weights might not be an ideal solution.
Furthermore, I built two models, for each gender, that predicted finding love at first sight. The findings indicate that there were gender differences in everyday activities as well as in mating and relating. Males were more interested in sports, watching sports on TV, and gaming while females preferred yoga, watching TV, theater, shopping, dining concerts, and art. Males preferred attractive females while females preferred ambitious men. The feature selection process showed that love at first sight does not necessarily guarantee a long-lasting relationship. For example, even though females reported they prefered ambitious men, ambition negatively predicted finding a match for both genders. Sincerity negatively predicated finding a match for males, and was a trivial predictor in finding a match for females. That is, both males and females did not consider sincerity an important factor in finding love at first sight, even though, both genders reported that they wanted sincerity in a relationship (since both genders reported them as important qualities in a potential date). Older females had a much harder time finding a match – for them age negatively predicted love at first sight, and those females who major in Film and Social Work were more likely to find a match compared with those who major in Biology/Chemistry/Physics.
These are just some highlights, and of course, love at first sight is not completely superficial. Both genders would choose a partner who they perceived shared interests with them, and those who valued intelligence in their partners were more likely to find a match. However, these findings cannot be applicable to the general population. Columbia students and students in general do not behave like the general population. To make these findings applicable to the general population, data should be collected from multiple speed dating events from various states, from all age groups, and from people with various economic backgrounds.
REFERENCES
-
Batista, G. E., Prati, R. C., & Monard, M. C. (2004). A study of the behavior of several methods for balancing machine learning training data. ACM Sigkdd Explorations Newsletter, 6(1), 20-29.
-
Chawla, Nitesh V., et al. “SMOTE: synthetic minority over-sampling technique.” Journal of artificial intelligence research 16 (2002): 321-357.Chawla, N. V., Bowyer, K. W., Hall, L. O., & Kegelmeyer, W. P. (2002). SMOTE: synthetic minority over-sampling technique. Journal of artificial intelligence research, 16, 321-357.
-
Japkowicz, N. (2000). The Class Imbalance Problem: Significance and Strategies. In Proceedings of the 2000 International Conference on Artificial Intelligence (IC-AI’2000): Special Track on Inductive Learning Las Vegas, Nevada.
-
Ling, C., & Li, C. (1998). Data Mining for Direct Marketing Problems and Solutions. In Proceedings of the Fourth International Conference on Knowledge Discovery and Data Mining (KDD-98) New York, NY. AAAI Press.
-
Nguyen, H. M., Cooper, E. W., & Kamei, K. (2011). Borderline over-sampling for imbalanced data classification. International Journal of Knowledge Engineering and Soft Data Paradigms, 3(1), 4-21.

