Introduction
The Billboard charts are the United States music industry standard popularity ranking, issued weekly by Billboard magazine. The Billboard charts rank songs relative to each other. The ranking is based on radio plays and sales (both physical and digital) data monitored by Nielsen Music, which electronically monitors radio stations in more than 140 markets across the United States.
The goal of this project was to perform an explanatory data analysis using the billboard data of 2000. The billboard data is interesting in terms of its unique structure and introduces some minor challenges for data cleaning. To analyze the 2000 chart, the data structure was reshaped using the pd.melt() function. Specifically, multiple columns, indicating a number of weeks in chart and peak position, were transformed into 2 columns. For the details, please see the python code.
Exploratory Data Analysis
During the year 2000, 317 songs entered and existed the billboard chart. The most frequent words in the titles of the songs were “love”, “wanna”, “baby”, “girl”, “God”, “friend”, “heart”, and “need.”
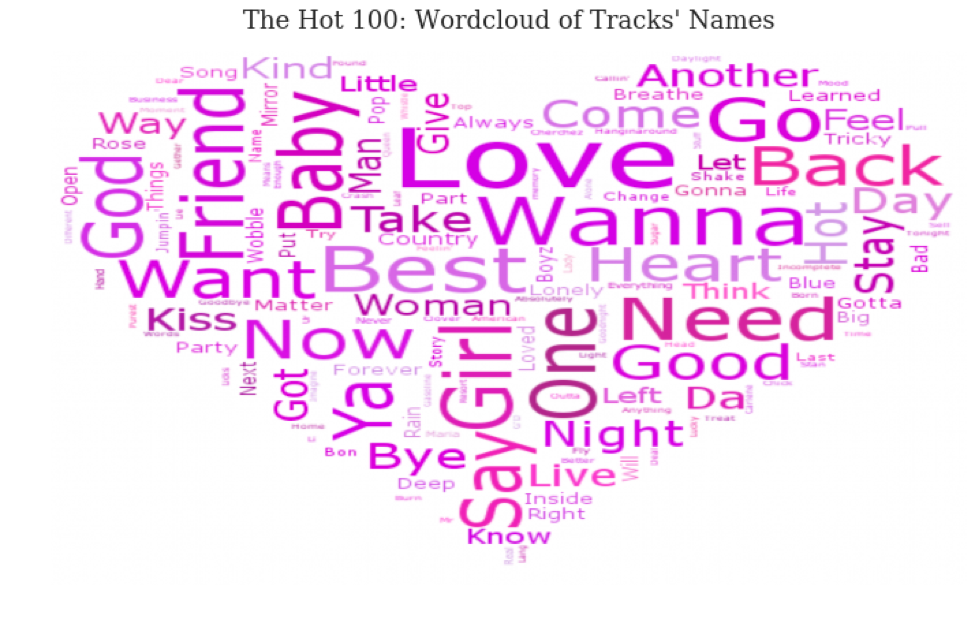
Unsurprisingly (or maybe surprisingly) it was all about love, and love was definitely in the air. That is, most of the songs’ titles contained the magic word LOVE.
I tried to find benchmark categories that could help me group and relate my data in order to extract the maximum amount of information. Finding the benchmark categories is extremely important for detecting a trend in data. For this reason, most of the data were grouped and explored by genre.
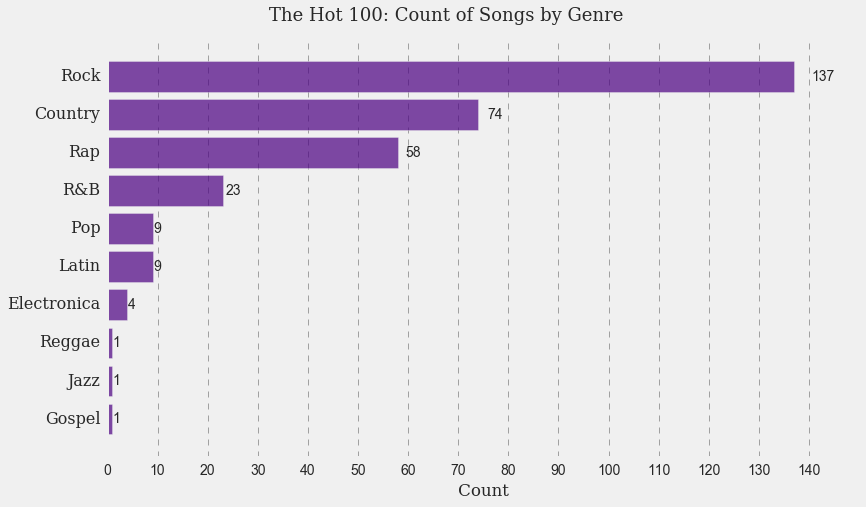
Out of 317 songs, there were 137 rock songs, 74 country songs, 58 rap songs, 23 R&B songs, 9 pop songs, 9 Latin songs, 1 reggae song, 1 jazz song, and 1 gospel song. That makes sense as rock was the most popular genre in the U.S. in 2000.
The average track length also varied by genre.
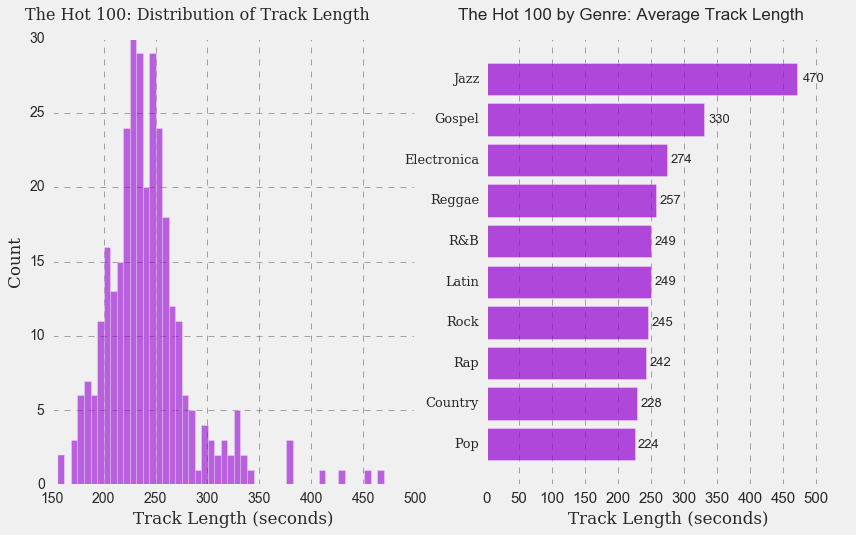
While length of most tracks ranged from 200 seconds to 280 seconds long, jazz, gospel, electronica, and reggae had the highest average track length. It is hard to say, however, whether it is a general trend, since the chart contains only a few songs of these specific genres.
A boxplot displays information about a statistical data set’s shape, variability, and median (middle of the data range). Below is the boxplot of peak position by genre.
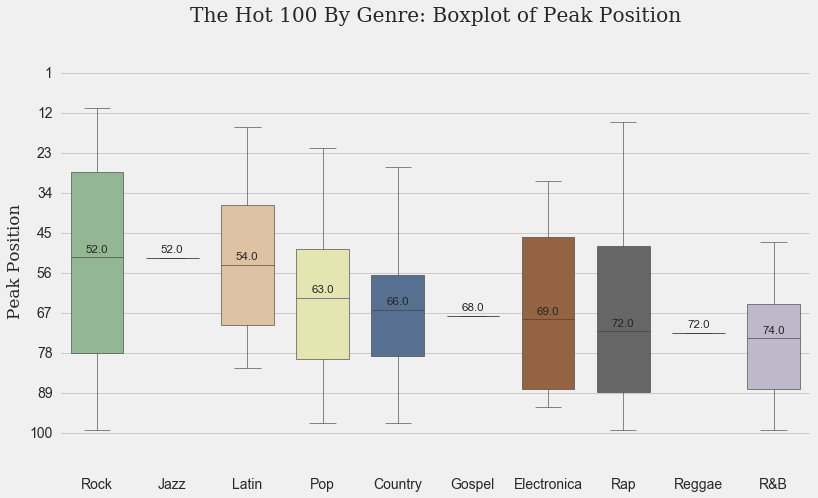
Note this plot is composed of an average peak position for each song—that is why you won’t see the top whiskers reaching the very peak position. The middle peak position was the highest for rock and jazz followed by Latin and pop. However, only rock songs had the highest variability among its peak positions. They had the highest and the lowest average peak positions. In other words, rock songs in the year 2000 either rocked or not.
The next logical step was to show a relationship between a peak position and the number of days it takes each song to reach the peak position. The bubble chart below explores this relationship by genre and track length. In this chart, track length is proportional to the bubble area. It takes around 120-200 days for most songs to reach their peak positions. Rock songs have the highest average peak positions in the chart, followed by rap and Latin music.
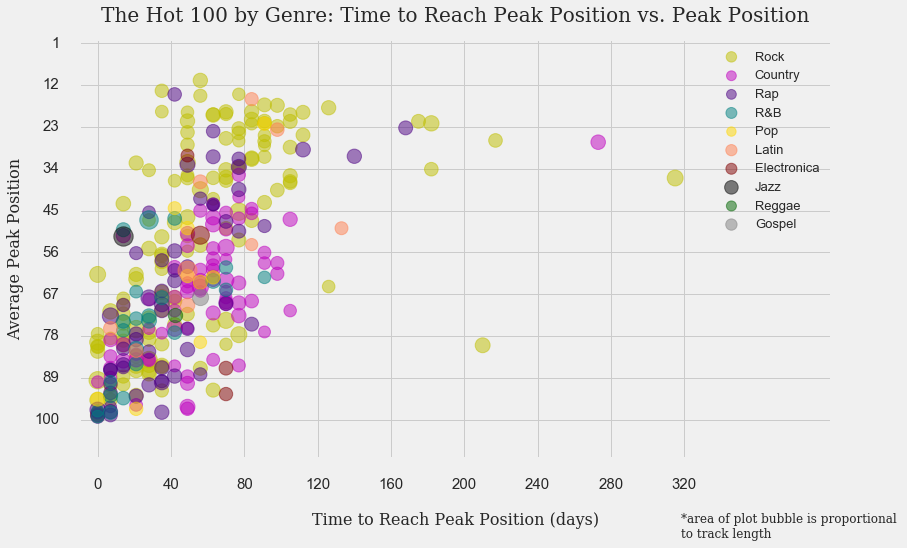
In general, rock songs’ average peak positions had the highest variability. Country, jazz, pop, electronica, gospel, R&B, and reggae songs rarely reached the highest peak positions or stayed at the highest peak positions for a long time. It is obvious from the chart that the track length did not affect either the number of days it takes to reach a peak position or the peak position itself. While most songs reached their peak positions within 120-200 days, there were several exceptions. Those songs were “Amazed” by “Lonestar” (273 days), “Kryptonite” by 3 Doors Down (217 days), “Sexual” by Amber (210 days), and “Higher” by Creed (316 days).
The time series plot below indicates that rock and country followed by rap stayed on the billboard chart longer than other genres.
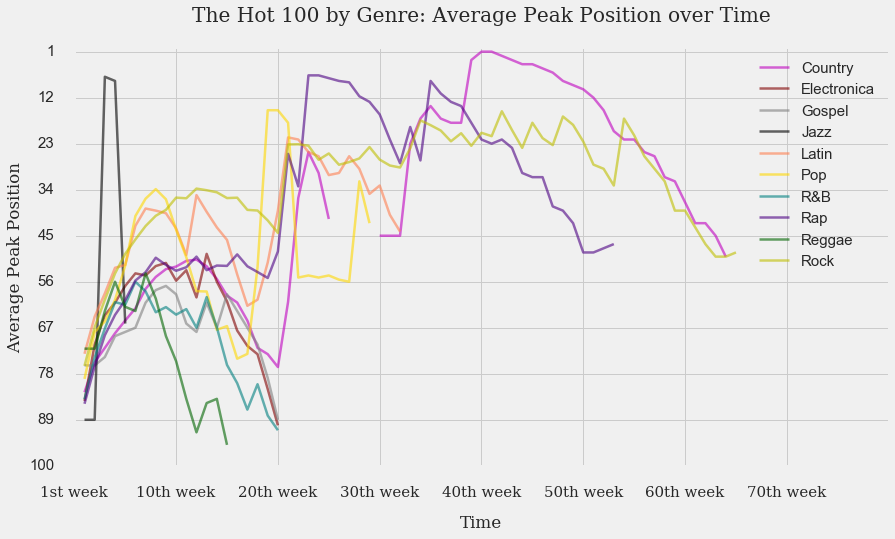
They also reached their peak positions later than the other genres. Pop and Latin music reached their peak positions sooner, but also exited the chart sooner than rock, country, and rap. It is hard to make a definite conclusion about reggae, R&B, jazz, and gospel as the number of songs representing these genres in 2000 is limited.
Finally, I looked at the number of days it took to reach the peak positions by the month the songs entered the chart. There has been an obvious trend that somewhat made sense.
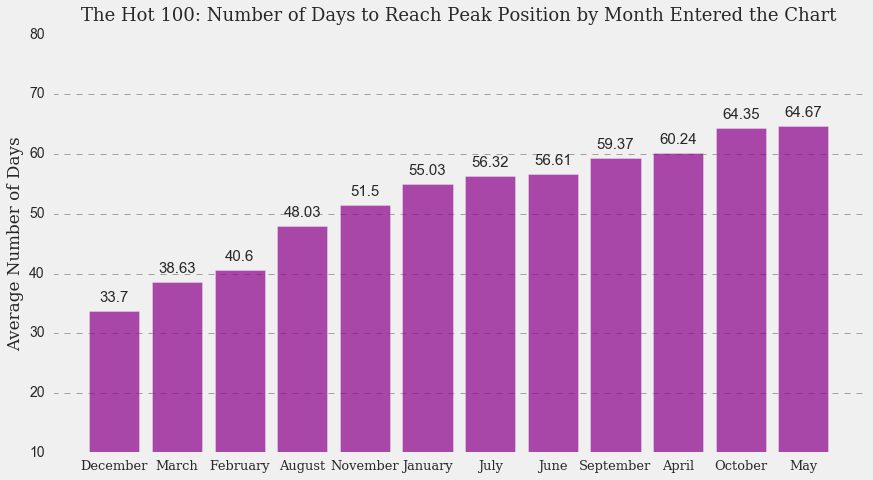
Songs that entered the chart in December, March, and February reached their peak positions sooner than songs that entered in the other months. December is a holiday month, sopeople are possibly in the mood to listen to more music. February is when the Grammy Awards are presented, so February has a plausible explanation as well. However, it is not that obvious what is so special about March. If you have an idea, send me an email. I would love to know.
Conclusion
Overall, rock songs dominated the billboard chart in 2000. It was the most popular genre that had the highest average peak position and stayed in the chart longer than any other genre. The second most popular genre in the U.S. in 2000 was country music followed by rap music. The track length had no effect on the popularity of songs or their longevity. Pop and Latin were more likely to reach their peak positions sooner, but they were also more likely to leave the billboard chart sooner. They had a much shorter longevity compared to rock and country. Most songs would reach their peak positions within 200 days. However, “Amazed” by Lonestar, “Kryptonite” by 3 Doors Down, “Sexual” by Amber, and “Higher” by Creed reached their top positions much later. Finally, love was the most popular theme in the 2000 billboard chart. Somethings tells me, though, it is the dominating theme of all times. But this would be a hypothesis for another explanatory data analysis.
